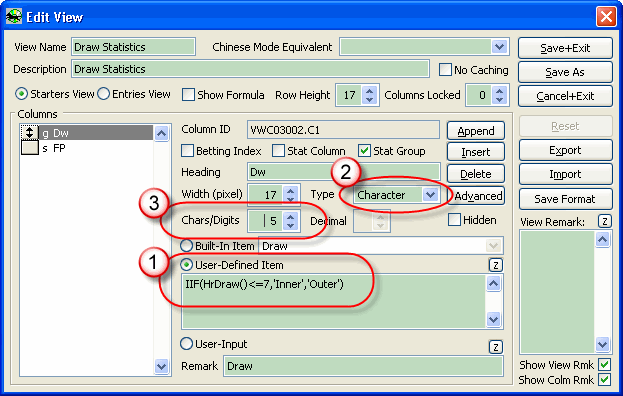
In order to compare the performance of the horses in inner and outer tracks, let us modify the "Stat Group" column of the statistical view of the above section.
| 1. | Select the Draw Statistics view. Open the Edit View form again and select the Draw column. |

| 2. | Change the column from [Built-In Item] to [User-Defined Item] |
| 3. | Change the [Type] of the column from Numeric to Character |
| 4. | Set the column width to 5 |

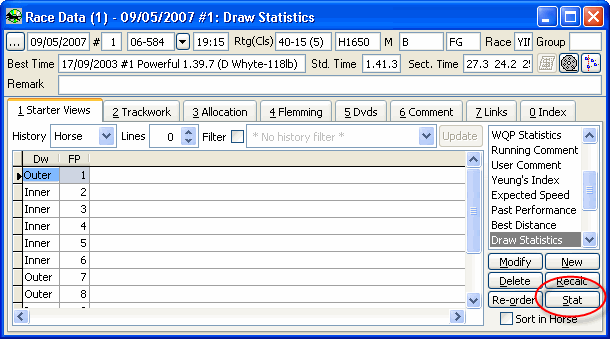
| 5. | Click on the [Stat] button to show the following "Statistical View Calculation" form |

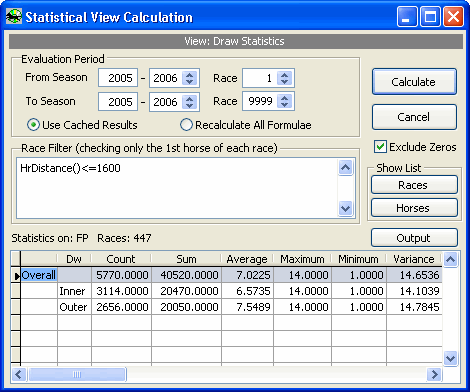
| 6. | Keep the existing filter expression (HrDistance( )<=1600) and click on the [Calculate] button to calculate the result in the lower part of the form. The result shows that the average finishing position of Inner tracks is 6.5735, which is significantly better than that (7.5489) of the Outer tracks. |
For more examples please see:
Find horses which win in 60 days after a stablechange
Page url: http://www.racematenet.com/english/help/index.html?statistical_groups.htm